Teacher Retention Dashboard
The Teacher Retention Dashboards display statewide teacher retention rates aggregated by preparation route, pathway into teaching, demographic group and gender.
Version 1: The data on this page reflects all available information through the most recently available academic year. It is best viewed on a desktop screen. The visualizations are generated by the Power BI application and best practices have been made to follow WCAG 2.0 standards. Specific keyboard commands are needed to access and navigate through the data which are not the standard keyboard commands some screen readers use. You can press Shift + ? to access keyboard shortcuts.
About the Data
This dataset includes all individuals who were employed as a teacher of record in a Texas public school with cumulative full-time equivalencies of 0.5 or higher. Academic years are between September 1st through August 31st. Retention by Preparation Route data spans from the academic years 2013-2014 until the current reporting year. Retention by Pathway to Teaching data spans from 2015-2016 until the current reporting year.
This dashboard was generated using these Business Rules.
Dashboard Data Downloads
The data behind the dashboard can be downloaded below.
- Teacher Retention Workbook - (Excel)
- Navigate to the first tab: Retention by Preparation Route
- Choose the First Teaching Year and Preparation Route from the drop-down menus on the top of the page. In this example, the user selected 2020-2021 and All for Preparation Route.
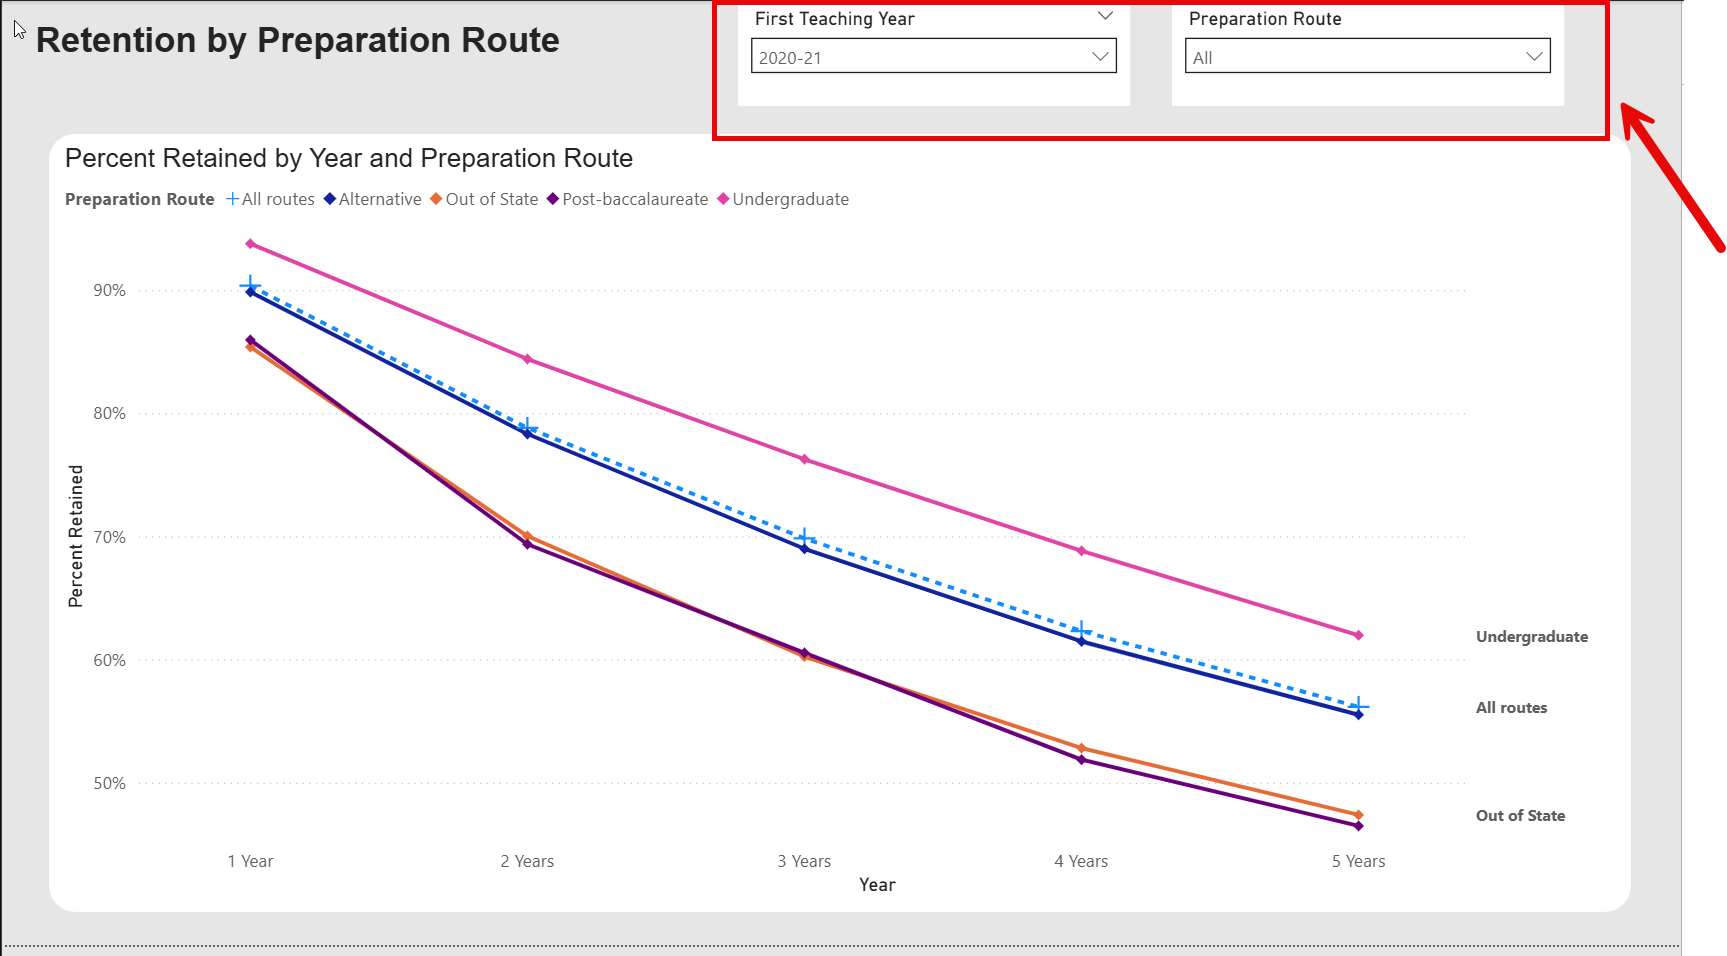
- The dashboard will now display 5 year percentages for teacher retention by preparation route.
- To see this data in table format, navigate to the “Retention by Preparation Route Table” tab.
- The dashboard will now display the percent of teachers retained by preparation route.
- Navigate to the tab: Retention by Pathway to Teaching.
- Choose the First Teaching Year and Pathway to Teaching from the drop-down menus on the top of the page. In this example, the user selected 2020-2021 and All for Pathway to Teaching.
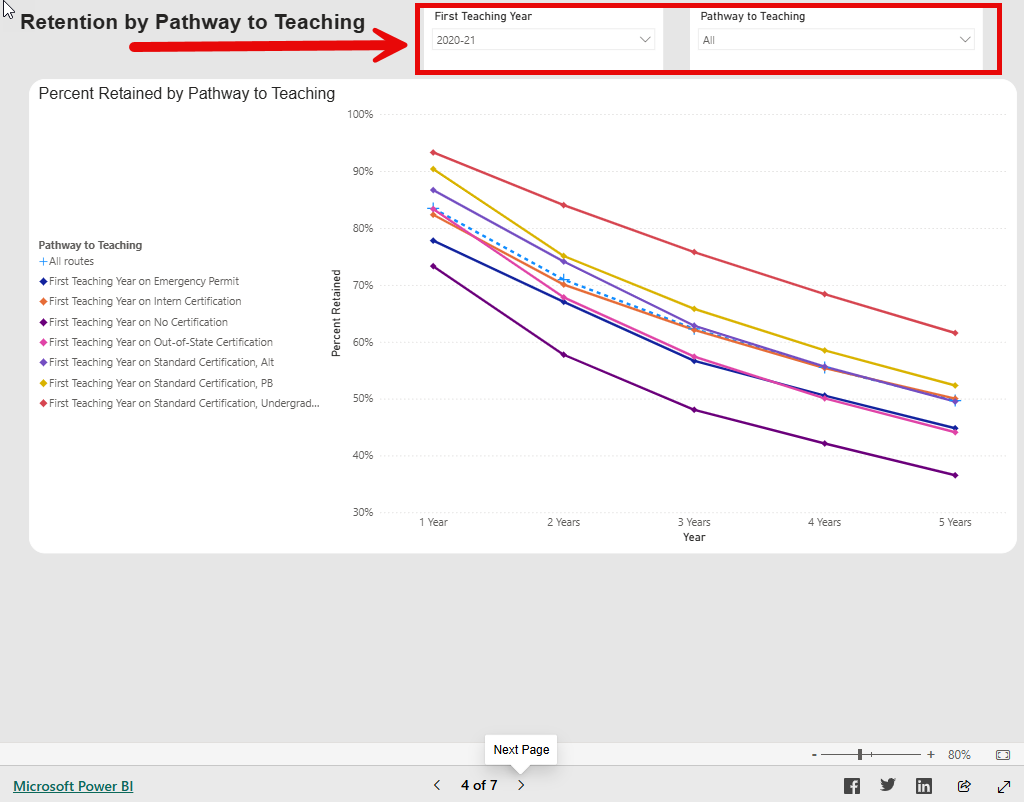
- The dashboard will now display 5 year percentages for teacher retention by pathway to teaching.
- To see this data in table format, navigate to the “Retention by Pathway to Teaching Table” tab.
- Navigate to the tab: Retention by Demographic Group.
- Choose the First Teaching Year and Preparation Route from the drop-down menus on the top of the page. In this example, the user selected 2020-2021 and All for Preparation Route.
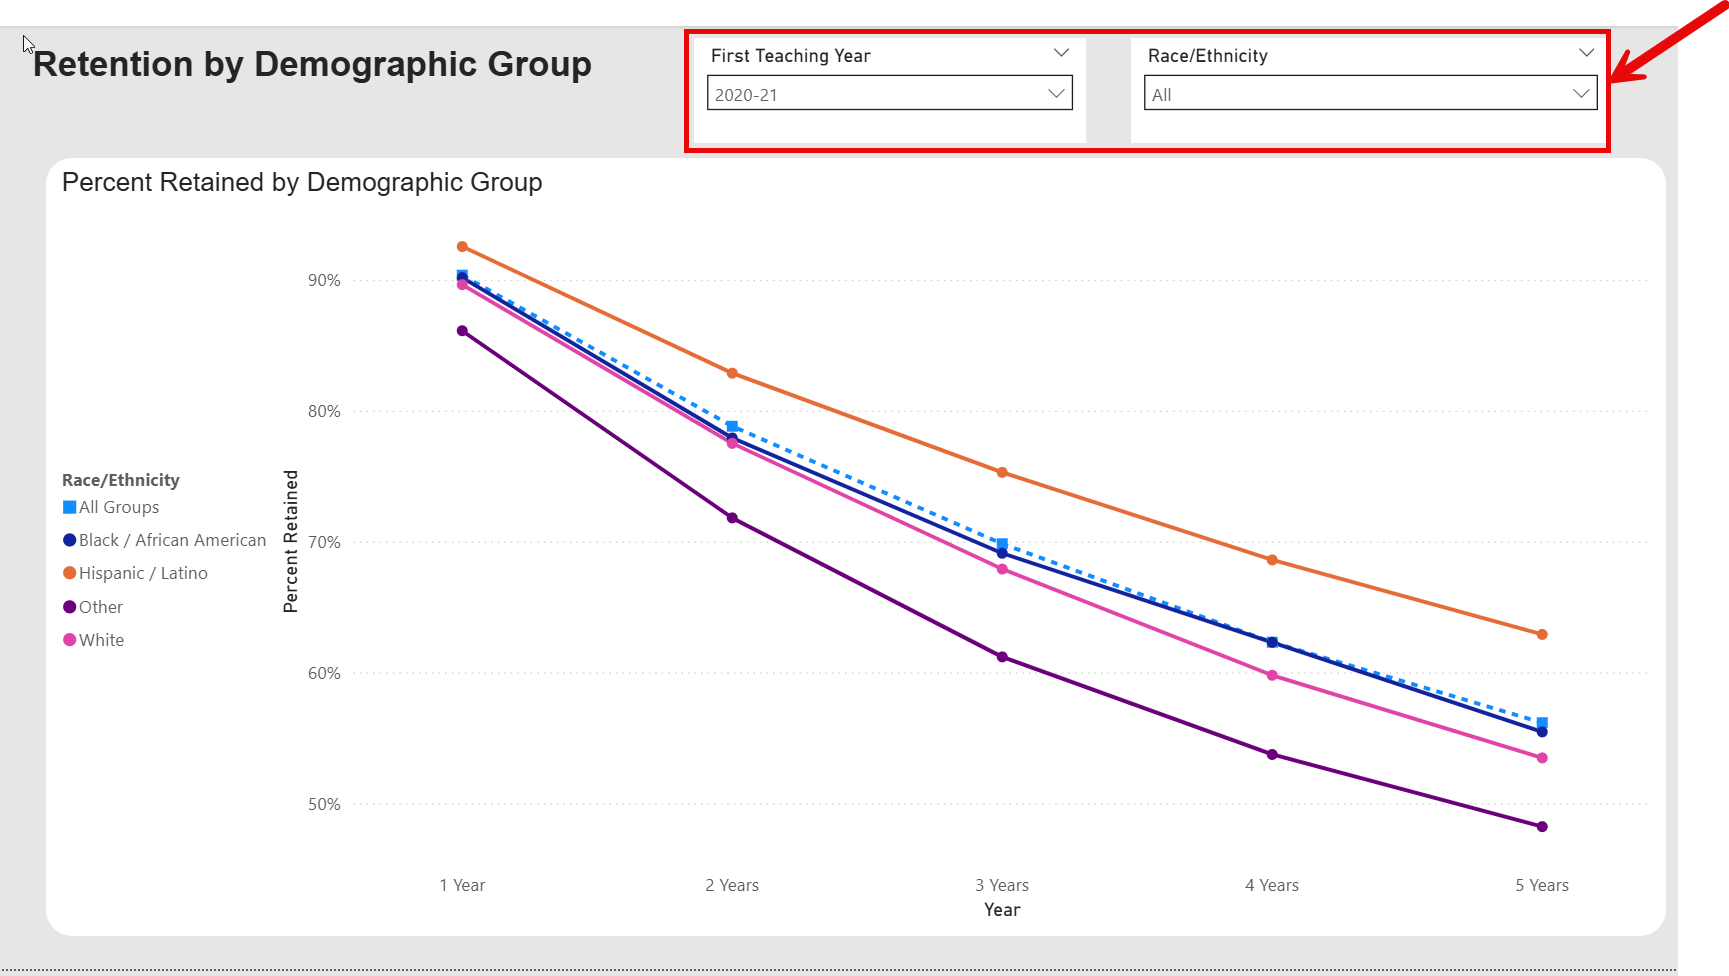
- The dashboard will now display 5 year percentages for teacher retention by Race/Ethnicity
- Navigate to the tab: Retention by Gender.
- Choose the First Teaching Year and Gender from the drop-down menus on the top of the page. In this example, the user selected 2020-2021 and All for Gender.
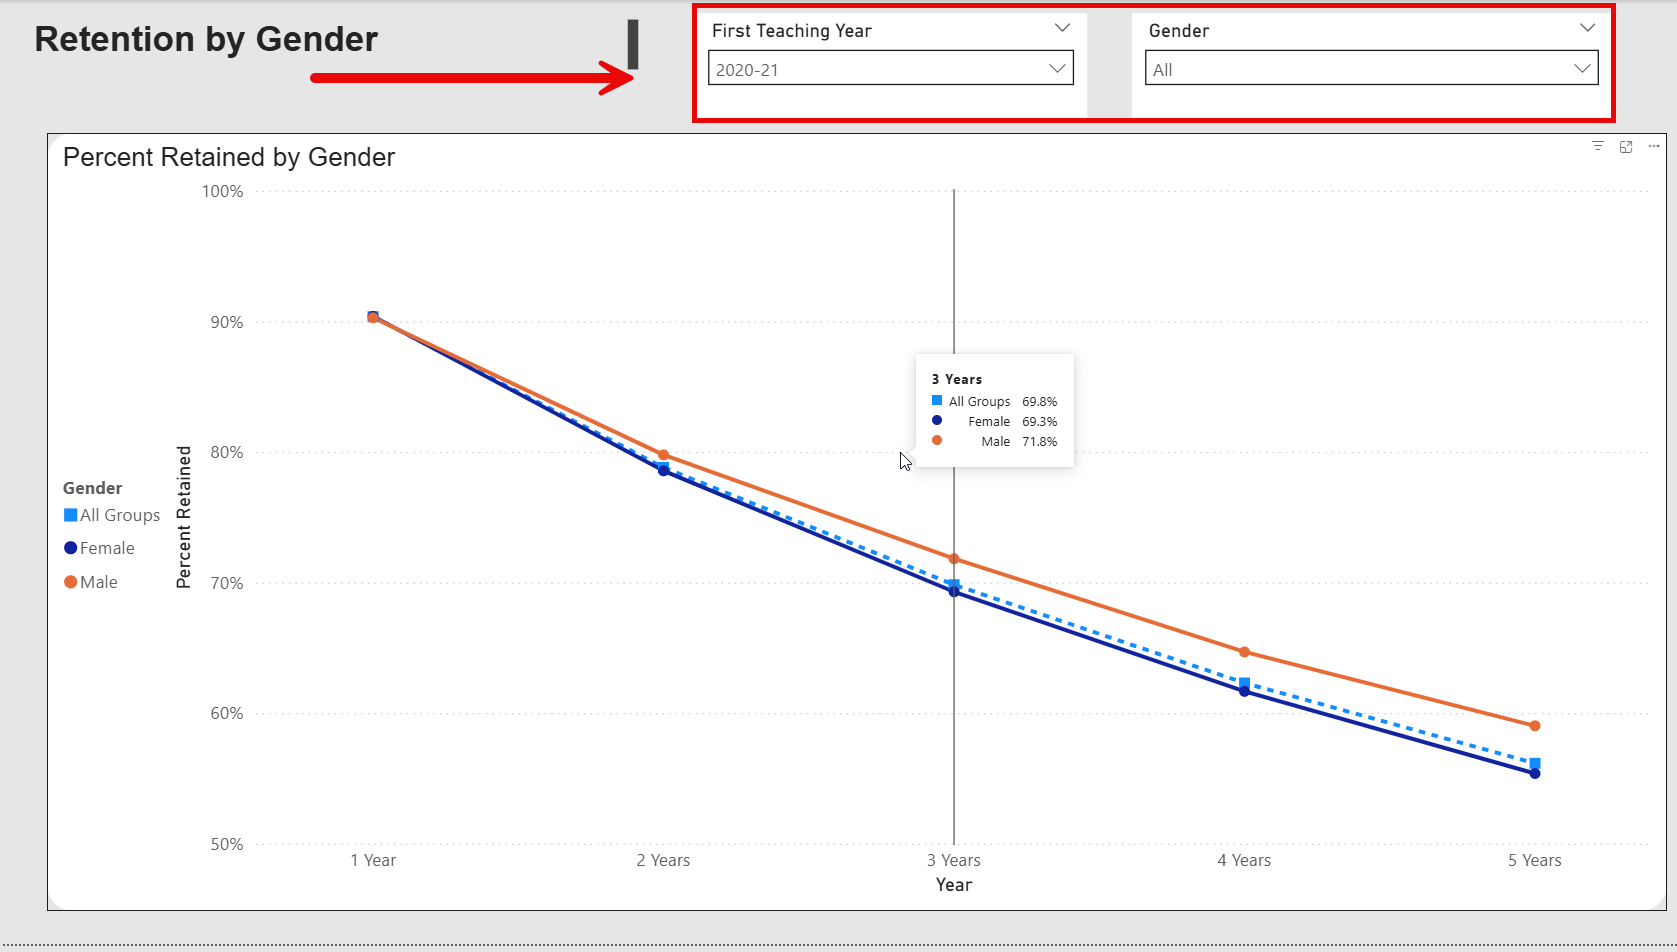
- The dashboard will now display 5 year percentages for teacher retention by Gender.
- The data is updated in the fall of each academic year.
- The Teacher Retention Workbook can be found here - (Excel)
Frequently Asked Questions
Click a question below to expand and view the answer.