Newly Certified and New Teacher Hires Dashboards
The Newly Certified and New Teacher Hires Dashboards provide an improved understanding of the routes to being hired as a teacher for newly hired educators, as well as the relationship between teacher preparation, certification pathways, and new teacher hires in Texas public schools.
Version 5: The data on this page reflects all available information through the 2025-2026 academic year. It is best viewed on a desktop screen. The visualizations are generated by the Power BI application and best practices have been made to follow WCAG 2.0 standards. Specific keyboard commands are needed to access and navigate through the data which are not the standard keyboard commands some screen readers use. You can press Shift + ? to access keyboard shortcuts.
See information about dashboard updates implemented for each version.
About the Data
This dataset includes all individuals who are newly prepared teachers available to teach and newly hired teachers in each academic year. Academic years are between September 1 - August 31. This data spans from the academic years 2009-2010 until 2025-2026.
This dashboard was generated using these Business Rules.
Dashboard Data Downloads
The data behind the dashboard can be downloaded below.
- Data Documentation - (Excel)
- New Supply New Hires (View 1) - (Excel)
- EPP Supply (View 2) - (Excel)
- New Hires by School System (View 3) - (Excel)
- New Hires by School System and EPP (Views 4 and 5) - (Excel)
Version Information
- Version 1 was created in January 2023 and reflected all information through the 2021-2022 academic year.
- Version 1.2 was created in February 2023 with updated information through the 2022-2023 academic year.
- Version 2 was created in March 2023 with updates through the 2022-2023 academic year.
- Version 3 was created in March 2024 with information through the 2023-2024 academic year. This version included an update that added two additional certification categories that were not represented in previous versions, which are Standard – Alt Cert and Standard – Post Bacc. Please see the first view of the dashboard for precise definitions of these categories.
- Version 4 was created in March 2025 with information through the 2024-2025 academic year. This version included several updates to data processing to create better alignment across reporting mechanisms. These updates include (but are not limited to):
- Process updates to use certification effective date together with snapshot date in a year to determine whether someone working at fall snapshot had a certification/permit or not. This impacted the fixed pathway assigned to all individuals.
- Removed teachers from the data who had less than .5 FTE in the teacher role (previously included) to align with other reporting.
- Added part-time teachers as a pathway to account for those individuals.
- Version 5 was created in March 2026 with information through the 2025-2026 academic year.
Frequently Asked Questions
Click a question below to expand and view the answer.
How do I find the count of newly certified teachers and new teacher hires?
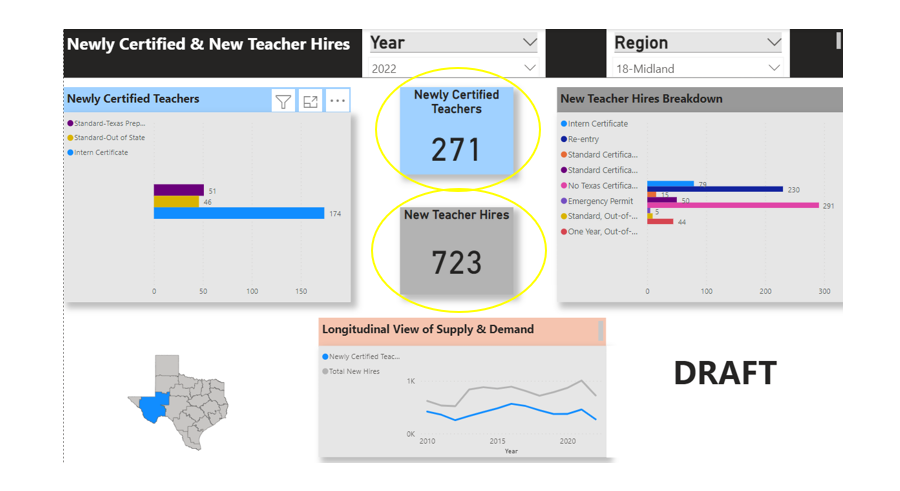
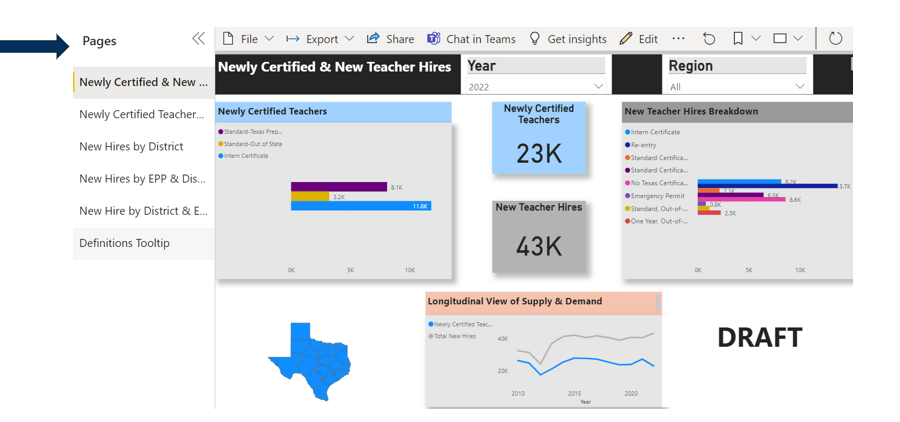
- Navigate to the first tab: Newly Certified & New Teacher Hires
- Choose a selected Year and Region from the drop-down menus at the top of the page

- The Newly Certified Teachers and New Teacher Hires cards will now display the counts. In this example, region 18 (Midland) had 271 newly certified teachers and 723 new teacher hires in the 2021-2022 school year.
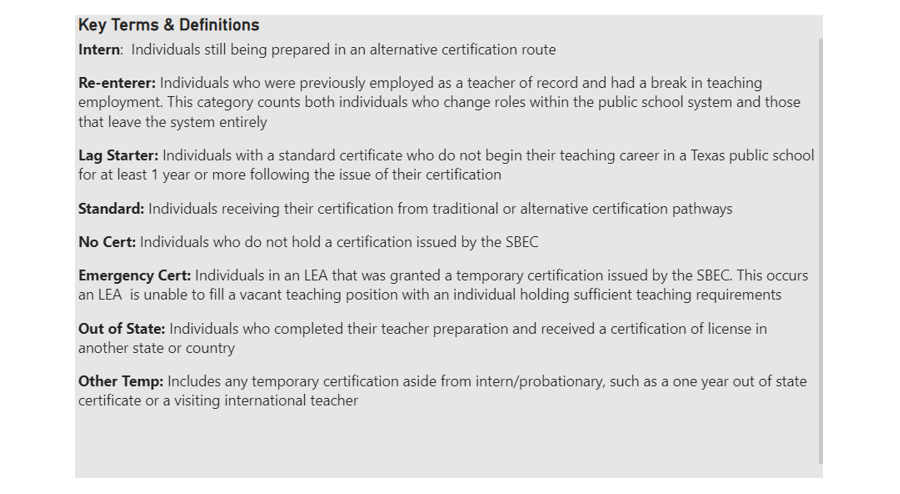
Where can I find the definitions of the different sources of new teacher hires?
- Navigate to the second tab of dashboard views entitled "Definitions", where you will find a list of key terms and definitions of new teacher hire sources
How do I find which EPPs are the biggest contributors of newly certified teachers?
- Navigate to the third tab of dashboard views: "Newly Certified Teachers by EPP Within Region"
- Select a Region, Year, and EPP from the dropdown menus at the top right, or click "Select all" to view statewide information
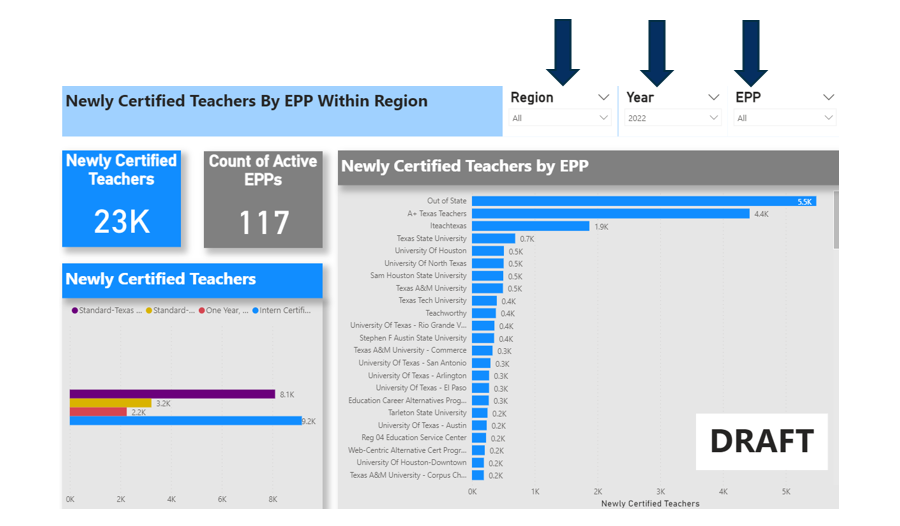
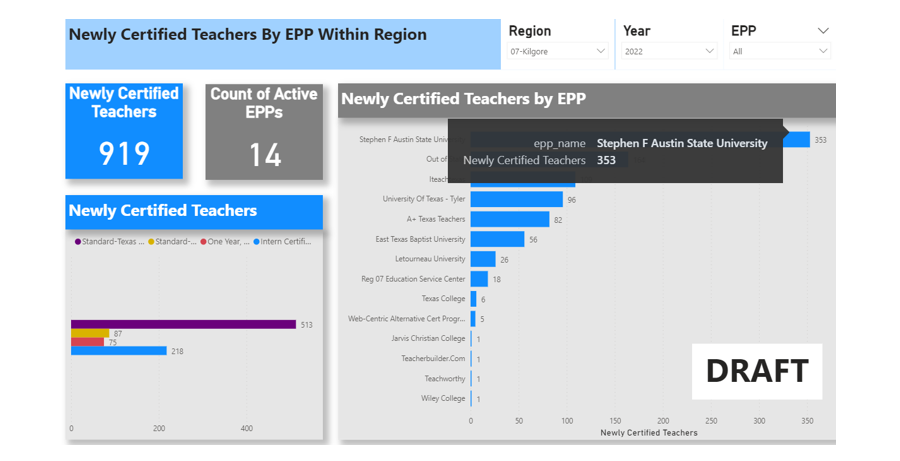
- The "Newly Certified Teachers by EPP" chart will display the counts of newly certified teachers by EPP. The "Newly Certified Teachers" chart will display the certification types of teachers. You can also hover over each bar to see exact numbers of teachers. For example, in region 7, Stephen F Austin State University had 353 newly certified teachers available in the 2021-2022 school year
How can I find the sources of new teacher hires?
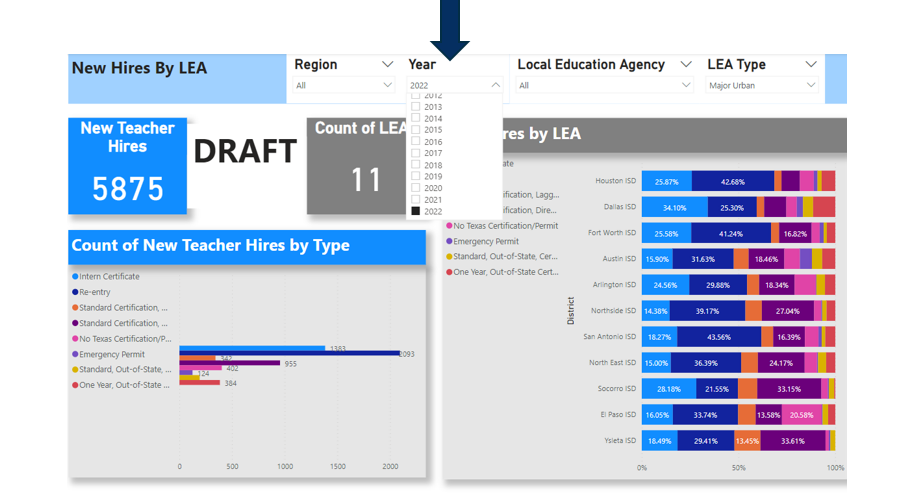
- Navigate to the fourth tab of dashboard views: "New Hires by LEA"
- Select a Region and Year from the drop-down menu at the top of the page or select all to view statewide information
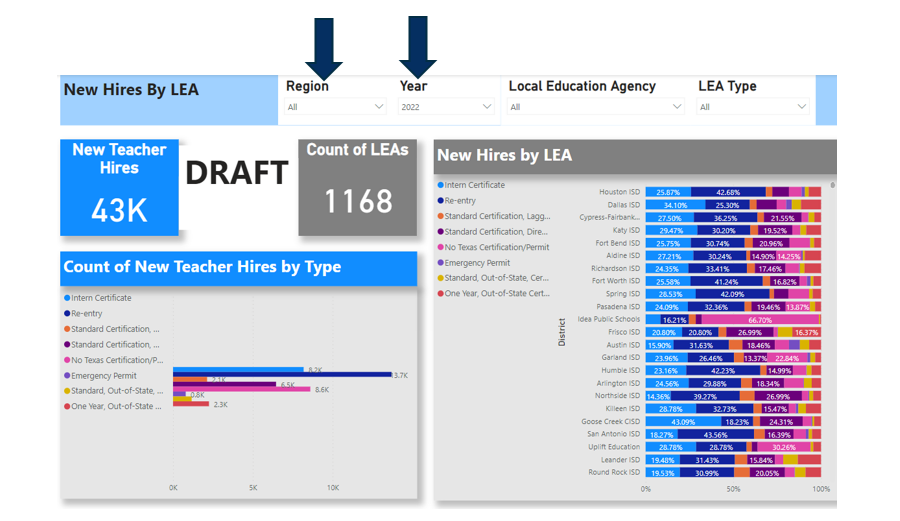
- The "New Hires by LEA" chart will display percentages of new hire sources in each Local Education Agency. The "Count of New Teacher Hires by Type" chart will display the counts of teachers according to the new hire source
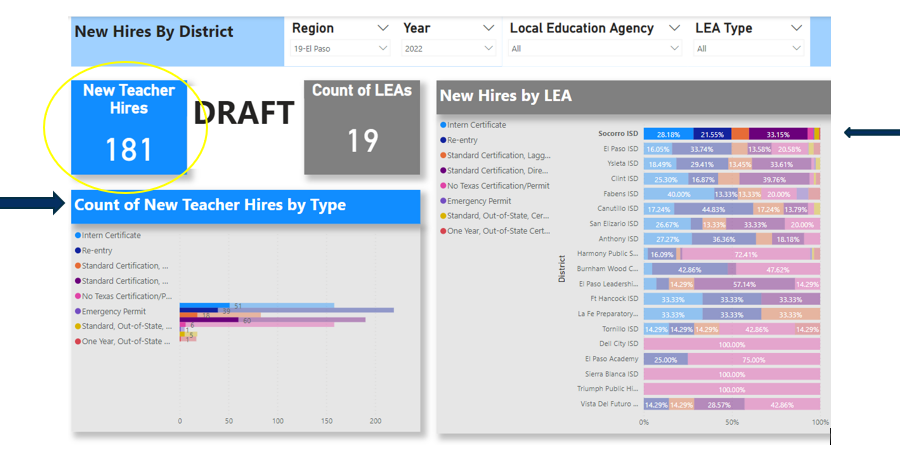
- In this example, Socorro ISD in region 19 had a total of 181 New Teacher Hires in the 2021-2022 year. The chart on the right titled "New Hires by LEA" shows that 28.2% of these new hires were intern certified, 21.5% were re-entering teachers, and 33.2% were standard certified-direct entry. The chart on the left titled "Count of New Teacher Hires by Type" displays raw counts of new teacher hires.
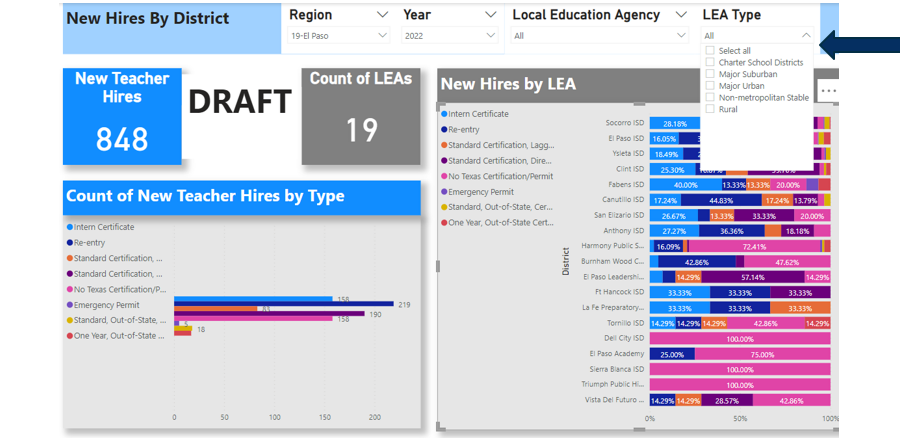
- To drill down further and examine new hire sources across a specific LEA type, select a specific LEA type from the drop-down menu at the top of the page
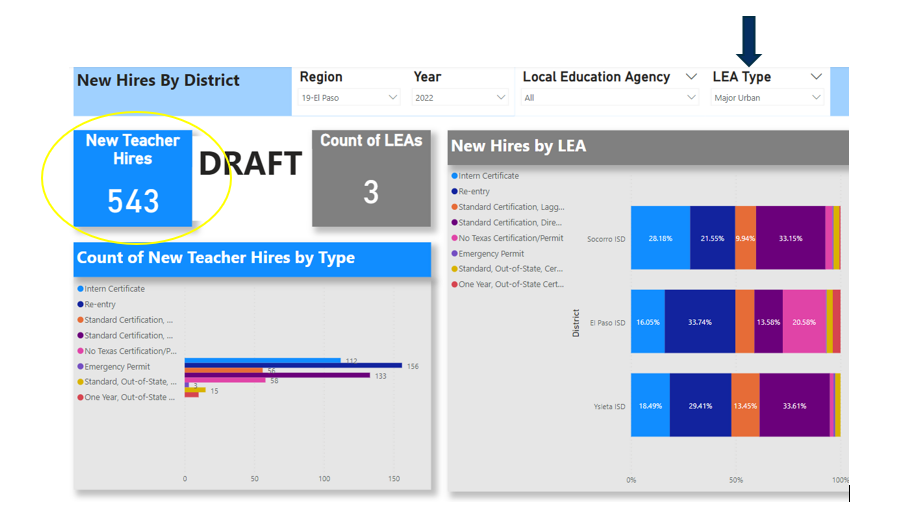
- You will now see the percentages and counts of new hire sources in your selected LEA type. In this example, region 19 had a total of 543 new teacher hires in 3 Major Urban LEAs: Socorro ISD, El Paso ISD, and Ysleta ISD. The New Hires by LEA chart displays the percentages of new hires according to their source, for each LEA. For example, in El Paso ISD, 16% of new hires were intern certified, 33.7% were re-entering teachers, 13.6% were standard certified-direct entry, and 20.6% did not hold a Texas certification.
How can I find where newly hired teachers are prepared?
- Navigate to the fourth tab of dashboard views: "New Hires by LEA"
- Select a specific Region, EPP Region, and Year from the drop-down menu at the top of the page, or Select All to see statewide information
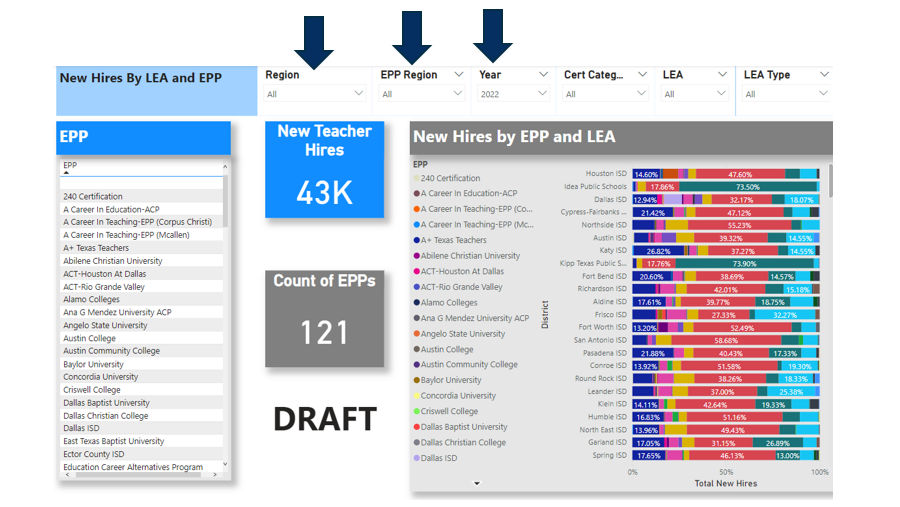
- The "New Hires by EPP and LEA" chart will now display the percentage of teachers from each EPP.
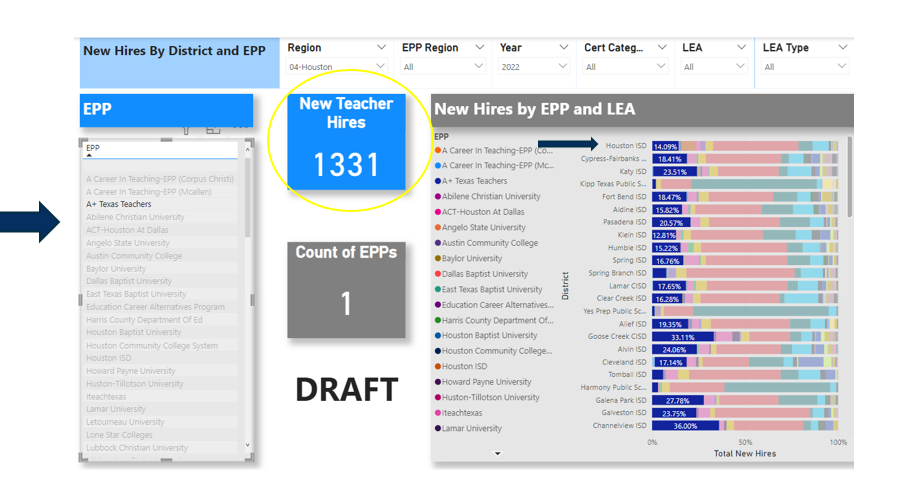
- To see the percentage of new hires in a specific EPP, you can select an EPP from the EPP list on the left-hand side of the page
- You can now see the percentages of new hires who were prepared at your selected EPP. In this example, 1,331 new teacher hires in region 4 were prepared at A+ Texas Teachers. 14.6% of newly hired teachers in Houston ISD (region 4) were prepared at A+ Texas Teachers.
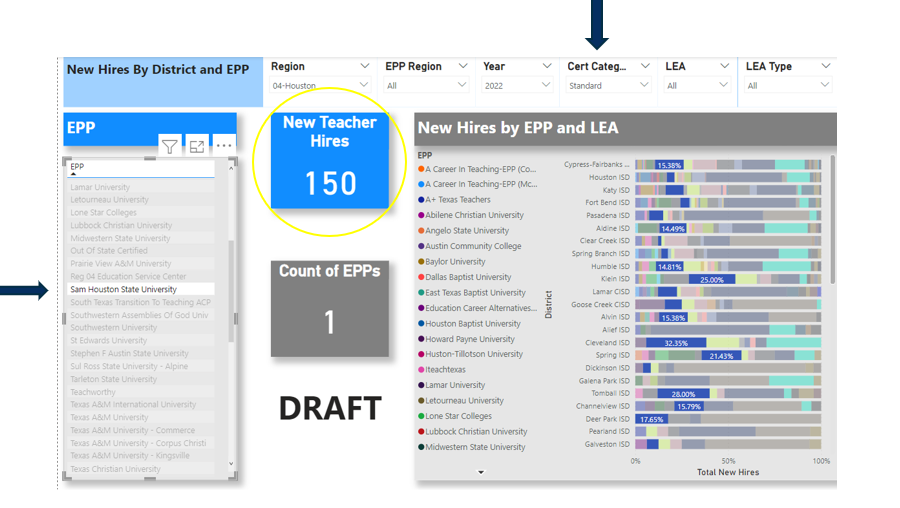
- You can further drill down by selecting various filters, including certification categories, LEA, and LEA type from the drop-down menu at the top of the page. In this example, we would like to calculate the number of Standard Certified teachers hired in region 4 and were prepared at Sam Houston State University. To make this calculation, select "Standard" from the Cert Categories drop-down menu, and select "Sam Houston State University" from the EPP list on the left side of the page.
- The resulting view shows that in 2021-2022, 150 standard certified new teacher hires in region 4 were prepared at Sam Houston State University.
How do I calculate the total number of new teacher hires that are prepared locally versus in a different region?
- On the same "New Hires by LEA and EPP" tab, select a specific region from the Region drop down menu, and select that same region in the EPP Region filter on the drop-down menu at the top of the page. We use Region 4-Houston in this example.

- We can see that Region 4-Houston has 3718 new teacher hires that were prepared at an EPP in that same region.
- Now, let's find out how many teachers are prepared in a region other than Houston. In the EPP Region filter, click on "Select all" then deselect Region 4 from the drop-down menu.
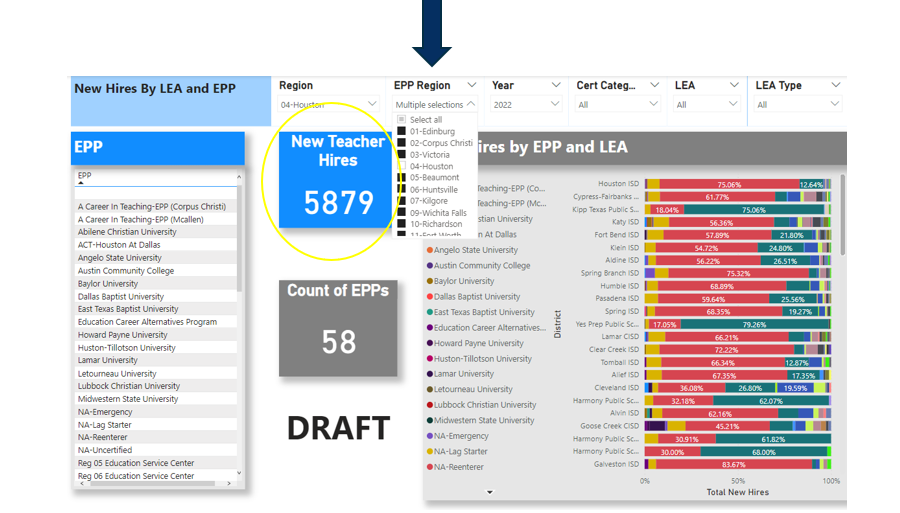
- We can see that 5,879 teachers were prepared in a region outside of Houston in the 2021-2022 school year.
How do I move between views?
- On the left-hand side of the page, you will see a list of tabs under "Pages"
- Use this list to toggle between the different views
How do I download the data?
- Datasets for each view can be found here.
When is the data updated?
- The data that will be updated in Spring of 2023 and will include information about newly hired teachers for the 2022-2023 academic year.
How do I select multiple options from the drop-down menus?
- Let's use year as an example. Select a year from the drop-down menu at the top of the page
- Press and hold the CTRL key on your keyboard, then click on a selection of years that you would like to examine:
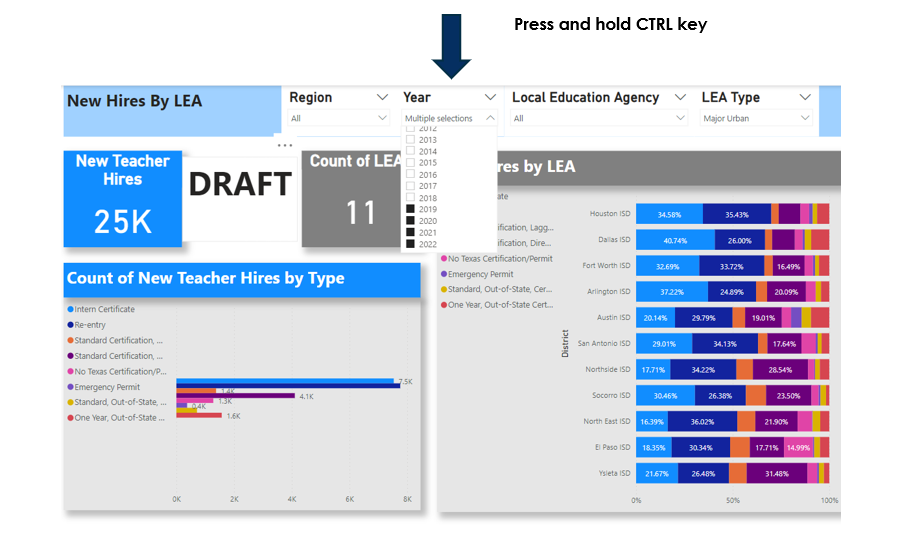
- Data from your selected years will now be displayed